Inside Super #2
How industry structure shapes competitive performance: the hidden forces behind market success
In this issue of Inside Super we cover industry structure and the link to fund outcomes. It’s a topic we have been writing about for many years, including being the first firm to popularise the notion of minimum efficient scale in profit-to-members super and to suggest that the ideal industry structure would be 3-5 mega funds and 8-10 specialist funds at scale. Similar conceptions of industry structure have since been adopted by many others, including Paul Keating and Bill Kelty, who predicted a low rate of survivorship, 10 funds (see here).
We are sending this issue to you directly, rather than via Campaign Monitor like the last one. If you missed the last issue –What’s your fund’s growth prescription, and what will be the outcome of it? – it is linked here.
Topic of this Inside Super

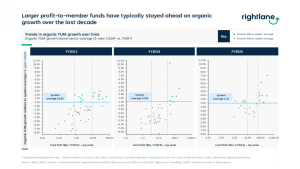
As you may know from our work, we’ve been writing about the structural dimensions of FUM growth for more than a decade. One of the most enduring exhibits in our annual Forces at Work Report plots 5-year FUM growth on the y-axis and FUM (log scale) on the x-axis. We like organic FUM growth as a metric, because it neatly captures funds’ ability to grow cash-flows, membership and members’ balances.
This exhibit, which is included below, shows that funds’ fortunes have fluctuated over the past 10 years or so – the one ‘constant’ though is that large funds’ FUM growth has been above the system average.
In the FY2013 chart, all small funds grew less than the system average, while the mid-sized funds ‘ranged across the y-axis’. In the most recent chart, some smaller funds are above the line.

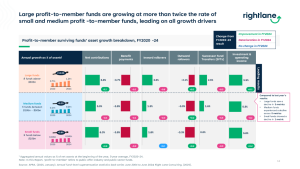
The next exhibit breaks down the sources of FUM growth; it includes all five sources – contributions, benefit payments, rollovers, investment and operating income AND SFTs, whereas the previous exhibit excludes inorganic growth.
This exhibit shows the large funds – the ‘Big 8’ profit-to-member funds – collectively outperforming on all 5 of those dimensions, with the smaller funds under $10bn doing better than midsize funds in aggregate on contributions and investment and operating income. Last year, the same chart showed mid-sized funds doing marginally better overall than small and large funds, driven by SFTs. The numbers move around a bit from year to year but the long term trend is compelling.
Although we have long advocated for the benefits of scale in superannuation, we recognise that in a more benign legislative and regulatory climate, smaller industry funds can also potentially thrive. Some of these funds, particularly those in robust industries with strong member alignment, solid investment capabilities, and persistently smart resource allocation, have the potential to secure a sustainable position in the future industry landscape. Of course, larger funds generally have more margin for error in decision making and resource allocation — more ballast in the boat, more ‘fiscal headroom’.
We have been exploring and writing about the sustainability of smaller funds for many years, including our work on strategic options for small to medium-sized funds. An excerpt of this work is available upon request.

We urge all our clients to contemplate the ramifications of the evolving industry structure, including its relationship to fund performance. Above we’ve focused on FUM growth as an indicator. We could have used other indicators that are perhaps closer to real member outcomes, like investment returns or investment and trustee office costs, for which we have good longitudinal data relating to their relationship with fund size. If you’re interested in seeing any of this data, let me know.
We suggest funds consider the following questions:
- How important is FUM growth as a measure of fund performance and long term ‘fund health’?
- How have you and how will you grow FUM, by pulling which levers?
- To what extent is the relationship between fund size and FUM growth likely to be enduring and what will that mean for your fund?
- If you are a smaller fund, how confident are you that you have what it takes to secure a sustainable position, for example via strong member alignment, solid investment capabilities, and persistently smart resource allocation?
We hope you find these insights useful. Please send me any feedback and if you would like I can publish it with the next issue, attributed or not, as you wish.
About Inside Super
The focus of Inside Super is on superannuation industry strategy, structure, scale economies, competition and growth – topics central to the work Right Lane has been doing for more than 25 years. We won’t be building the content from scratch. We’ve been writing about forces at work in the industry for 13 years in our annual, subscriber-only Forces at Work in Super Report.
In each issue, I choose a chart or two from the back issues of the Report (there’s ~1,100 pages to draw from!), and connect them up with something that’s happening right now in, for example, the competitive arena or the policy discourse. I also make some observations and suggest some questions you and your team should contemplate.
With the 2025 Forces at Work Report having been recently released, we are in presentation mode. If you are wondering whether your organisation is a subscriber, and if so whether you can get a copy, or if you would like us to present some of the Report findings to your team, please let me know.
I plan on writing editions of Inside Super semi frequently. If you do not wish to receive these updates, please let me know via return email and I will take you off the list.
