Inside Super #4
Cash Flow Velocity: who has it and does it matter more than Asset Momentum?
In this issue of Inside Super, we explore whether Cash Flow Velocity tells us more about ‘fund health’ than Asset Momentum.
This year, our Forces at Work report noted that Cash Flow Velocity is concentrating in a small group of very large profit-to-member funds, giving their investment teams greater flexibility.
In 2024, 8 profit-to-member funds recorded positive cash flows — that is, more money coming in through net contributions and roll-ins than going out through benefit payments and roll-outs – exceeding $1bn. These were also the 8 largest funds.
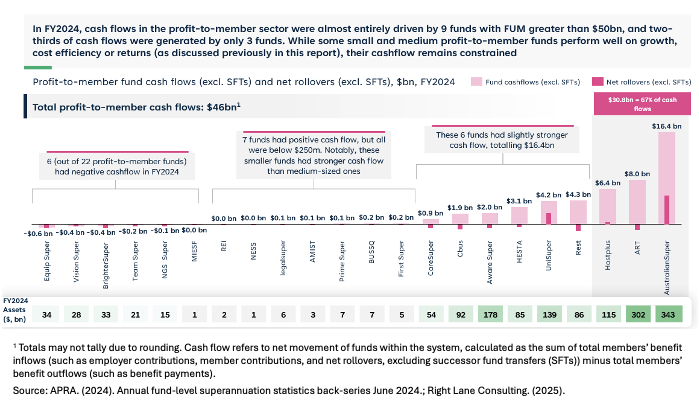
Three funds stood out with net cash flows above $5bn: Hostplus ($6.4bn), ART ($8.0bn) and AustralianSuper ($16.4bn). As the exhibit shows, the composition of these flows varies: AustralianSuper and UniSuper benefited from strong net roll-overs (switching flows), while ART and Rest faced outflows from roll-overs but offset these with other inflows to remain positive overall.
When I started in super, I saw funds under management (FUM) growth as a key fund success metric, and I still do, given all that it captures. But an experienced CIO once advised me to pay more attention to cash flows because of the flexibility they provide investment teams.

Industry reporting typically focuses on ‘organic’ or member cash flows (net contributions and roll-ins minus benefit payments and roll-outs). This overlooks market-related flows such as dividends, interest, trust distributions, redemptions, rental income, tax refunds, minus investment management fees, transaction costs, and tax payments. For AustralianSuper, for example, market flows likely add at least 50% on top of member flows based on what is disclosed, and probably much more. I’ve used AustralianSuper as an example as I was able to find more publicly available information on its cash flow components than most funds.
While member flows and market flows differ in timing and volatility, the combination of both strengthens a fund’s ability to capture opportunities, rebalance portfolios and manage liquidity.
But is Cash Flow Velocity truly a better indicator of fund health than FUM growth or Asset Momentum? I don’t think so. It’s a false choice. Cash Flow Velocity is a finer-grained lens, reflecting factors like demographics, member sentiment and marketing effectiveness. FUM growth is the ‘outer circle’, a broader measure, encompassing all cash flows plus market/asset value changes and successor fund transfers (SFTs). The accelerant to economies of scale, FUM growth integrates everything into a single headline indicator of fund health, providing a clear, visible signal of momentum to stakeholders.
Questions for funds to consider
Defining and measuring ‘fund health’
- What are your preferred benchmarks for ‘fund health’?
- How should we define success in managing cash flows? Is continual growth always in members’ best interests or can excessive inflows create unanticipated challenges?
Understanding cash flow composition
- Do you track net market flows (dividends, distributions, rental income, etc.) separately from member flows? If so, how is this reported internally?
- What proportion of your total Cash Flow Velocity is typically market-driven versus member-driven, and how does that change year to year?
Peer positioning and competitive insights
- Where does your fund rank on net member flows compared to peers, and how do you interpret that position?
- How do you separate ‘structural’ advantages (e.g. demographics, employer ties) from ‘strategic’ ones (e.g. marketing effectiveness) in your cash flow metrics?
Resilience
- How do your Cash Flow Velocity metrics respond under stress scenarios (e.g. member withdrawals, market downturns)?
- How can your fund strengthen its efforts to retain members as they approach and enter retirement, given intensifying competition between industry funds and with platforms, and advisers being increasingly influential in rollover decisions?
***
We hope you find these insights useful. Please send me any feedback and if you would like I can publish it with the next issue, attributed or not, as you wish.
With the recent release of our 2025 Forces at Work Report, we are in presentation mode. If you are wondering whether your organisation is a subscriber, and if so whether you can get a copy, or if you would like us to present some of the Report findings to your team, please get in touch.
***
The author wishes to thank the clients who reviewed drafts of this article for their thoughtful suggestions.
While all views and conclusions are the author’s own, the drafting process benefited from editorial support provided through OpenAI’s ChatGPT.
About Inside Super
The focus of Inside Super is on superannuation industry strategy, structure, scale economies, competition and growth – topics central to the work Right Lane has been doing for more than 25 years. We won’t be building the content from scratch. We’ve been writing about forces at work in the industry for 13 years in our annual, subscriber-only Forces at Work in Super Report.
In each issue, I choose a chart or two from the back issues of the Report (there’s ~1,100 pages to draw from!), and connect them up with something that’s happening right now in, for example, the competitive arena or the policy discourse. I also make some observations and suggest some questions you and your team should contemplate.
With the 2025 Forces at Work Report having been recently released, we are in presentation mode. If you are wondering whether your organisation is a subscriber, and if so whether you can get a copy, or if you would like us to present some of the Report findings to your team, please let me know.
I plan on writing editions of Inside Super semi frequently. If you do not wish to receive these updates, please let me know via return email and I will take you off the list.